

The sections of the "Processes" module
You can access the "Processes" module in Portal Manager by clicking on the module bar. Find out how to create and manage processes here.
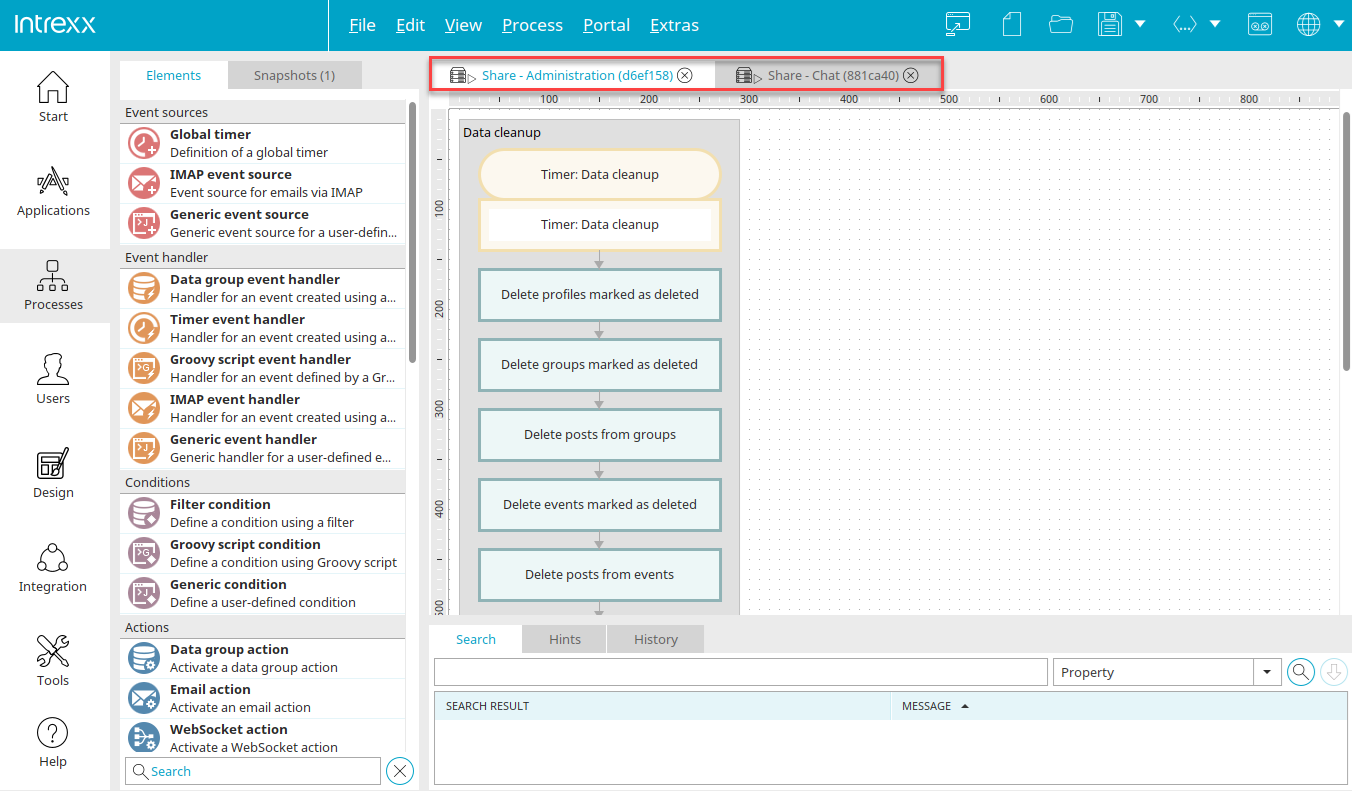
Each open process can be accessed via its own tab above the workspace. If an entry has been created in the history, the entry's ID (abbreviated form) is displayed on the tab next to the process name. Simply click on the tab to switch to a different process.
All other tabs identify the individual sections of the module.
You can close them by clicking the "  " icon to the right of the title.
You can display different sections using the "View" option in the main menu. You can use the title in the tab to change the order of the sections using drag-and-drop.
You can open a process's Properties dialog box by double-clicking the tab above the workspace.
Process Characteristics
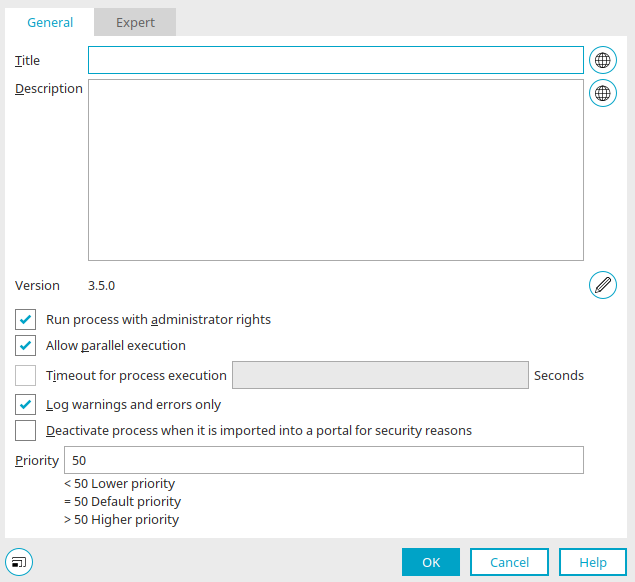
Title and Description
Enter the title and a description of the process here.
 Multilingualism
Each one opens a dialog box where you can enter the title or description in the various portal languages.
Version
The current version number is displayed here.
 Open the Version Manager
Opens a dialog box where you can enter the version number.
Run the process with administrator privileges
With this setting, the process runs regardless of the permissions of the user who initiated it. If this setting is disabled, the user's permissions are taken into account when accessing data.
Allow parallel execution
With this setting, the same process can be executed multiple times simultaneously (e.g., simultaneous timer or data group actions).
Please change this setting only if the use case requires it and if disallowing parallel execution will not result in any undesirable effects, such as deadlocks.
Timeout for process execution
Specifies the time limit, in seconds, that a process may take. When using Groovy script, this setting takes effect only if the script checks for interruption requests. As long as the workflow engine is in control, it checks whether the timeout has been exceeded. Calling `checkInterrupted()` is recommended in Groovy scripts that have a long runtime, because in this case the workflow engine has handed off execution to the script.
Log only warnings and errors
This setting limits the logging of process steps to the process log file to warnings and errors.
Enable this setting only if you are certain that the process works properly and consistently. A limited log can make troubleshooting more difficult, as it may not be clear which process steps occurred before or after an error.
Disable the process when importing into a portal for security reasons
If elements such as timers are included in processes and cause unwanted changes (e.g., data group actions) when imported into other portals, this setting can be used to prevent the process from running. This setting is automatically configured when you use the wizard to create a new process and thereby create a time-based process. It is set on request when a new event source is created and configured for the first time, and the setting has not yet been set for the current process.
Priority
You can enter an integer here to define the process's priority. Processes can thus be assigned a priority attribute that determines the order of execution when multiple processes are responsible for an event. The default value of 50 is already entered; higher values have higher priority, and lower values have lower priority.
Enable and Disable Processes
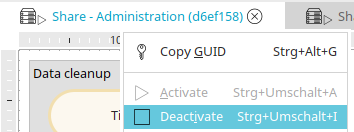
Processes can be disabled so that process elements—such as a timer—are not executed automatically. You can find the corresponding function in the context menu by right-clicking the process title in the tab above the workspace, or via the main menu under "Process / Deactivate" when the process tab is selected.
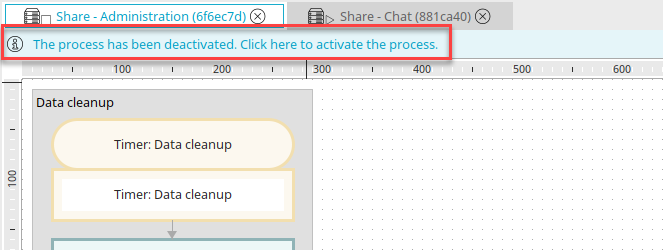
If a process is deactivated, you'll see the link "The process is deactivated" above the workspaces. "Click here to activate the process." Clicking on it opens a dialog box.
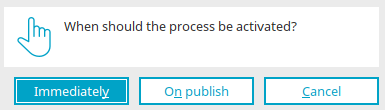
If you select "Immediately," the activation takes effect right away on the server. With "Upon Publication," the process is initially marked as active only. The activation will take effect the next time you publish to the server. This dialog box also appears when a process is disabled. Here, too, you can disable it immediately or upon publication.
Elements
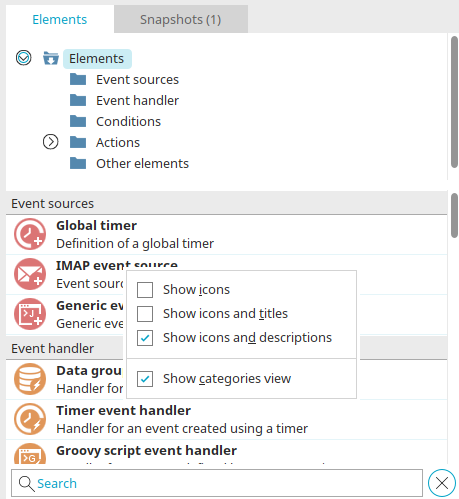
You can find all the information about this topic here.
Snapshots
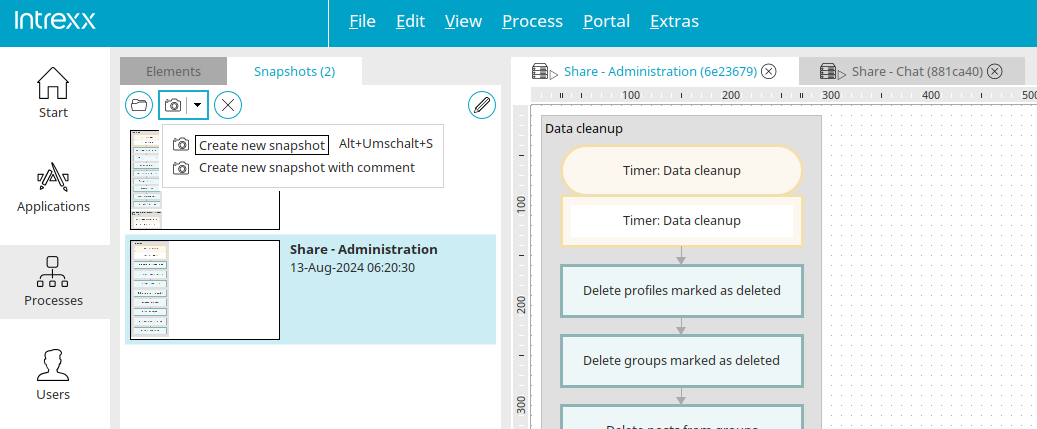
Snapshots are used to temporarily save the current process at specified intervals.
In the default view, you'll find the "Snapshots" section right next to the "Items" section. Click the "Snapshots" tab to bring that section to the foreground.
Clicking on one of the snapshots restores the process to its state at that point in time.
 Create a new snapshot
Opens a submenu that allows you to create a new snapshot. The "Create New Snapshot with Comment" submenu opens a dialog box where you can add a comment to the new snapshot.
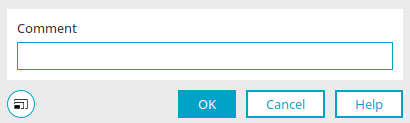
The comment you can write here will appear in the snapshot section below the date the snapshot was created after you click "OK." You can also find the dialog box in Layouts when you create snapshots there.
 Open the selected snapshot
Loads the selected snapshot onto the workspace.
 Settings
Opens a dialog box where you can specify the maximum number of snapshots to be created and the time interval for automatic creation.
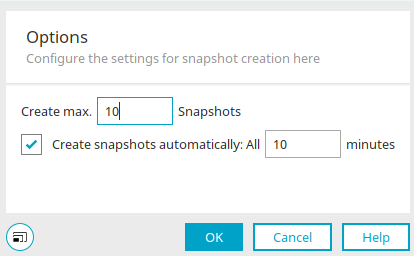
You'll also find this dialog box in Layouts when you create snapshots there.
Maximum ... Create snapshots
This setting specifies the maximum number of snapshots to be created.
Create snapshots automatically every ... minutes
This is where you set the time interval for automatically creating snapshots.
Work surface
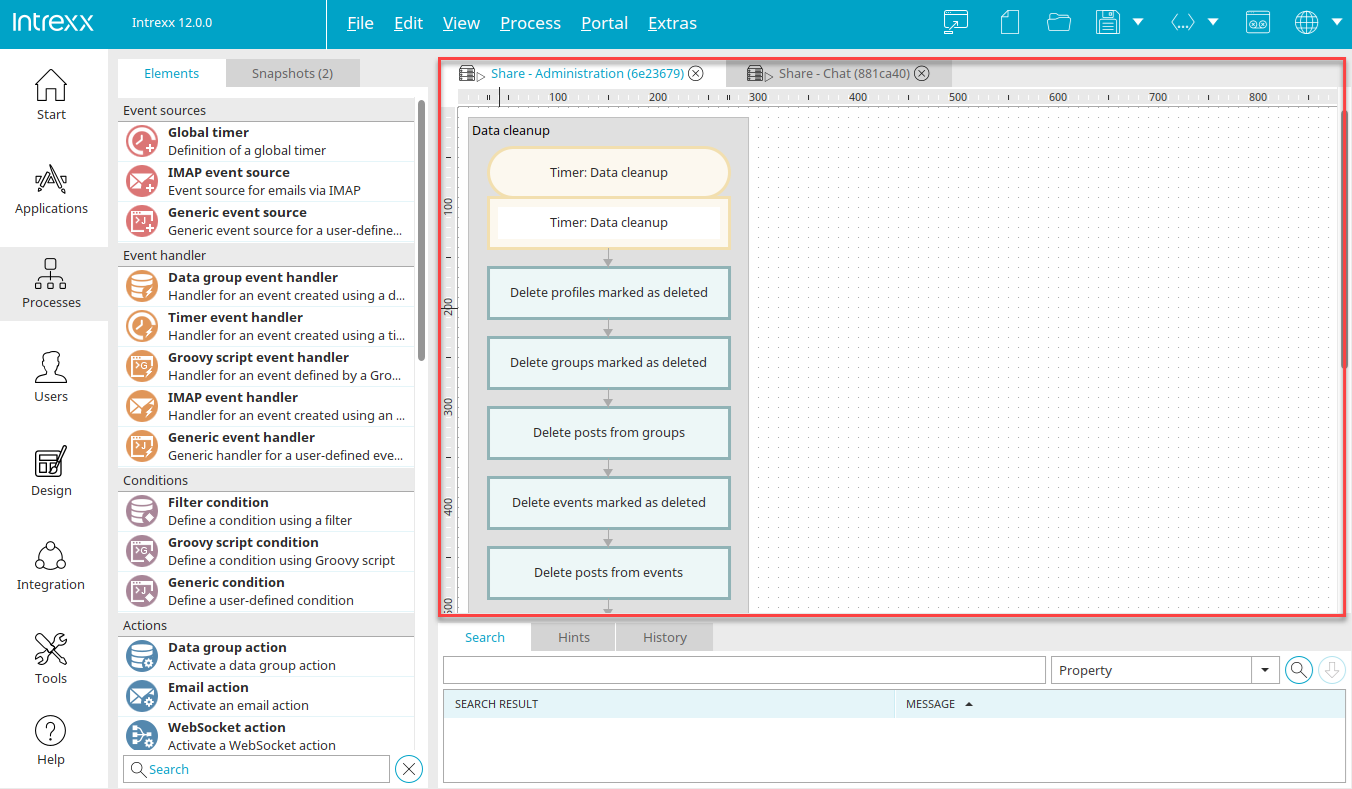
In the center, you'll find the workspace where all process elements can be arranged and linked together to form a process.
Process Overview
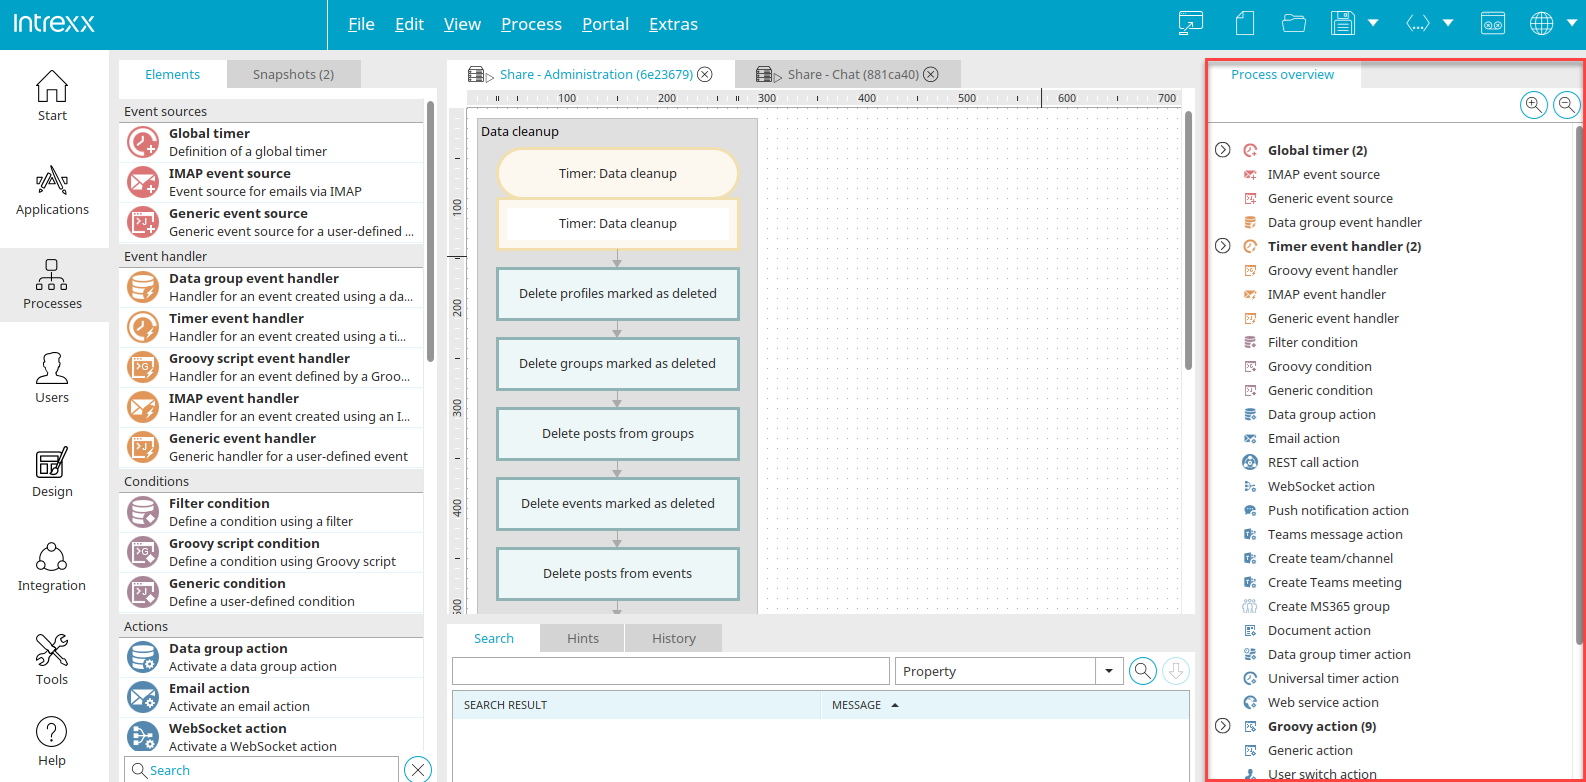
The elements created on the workspace are listed here, sorted by element category. If you select the item here, it will also be selected on the workspace.
If this section is not visible, you can display it from the "View" menu in the main menu if necessary.
Bird's-eye view
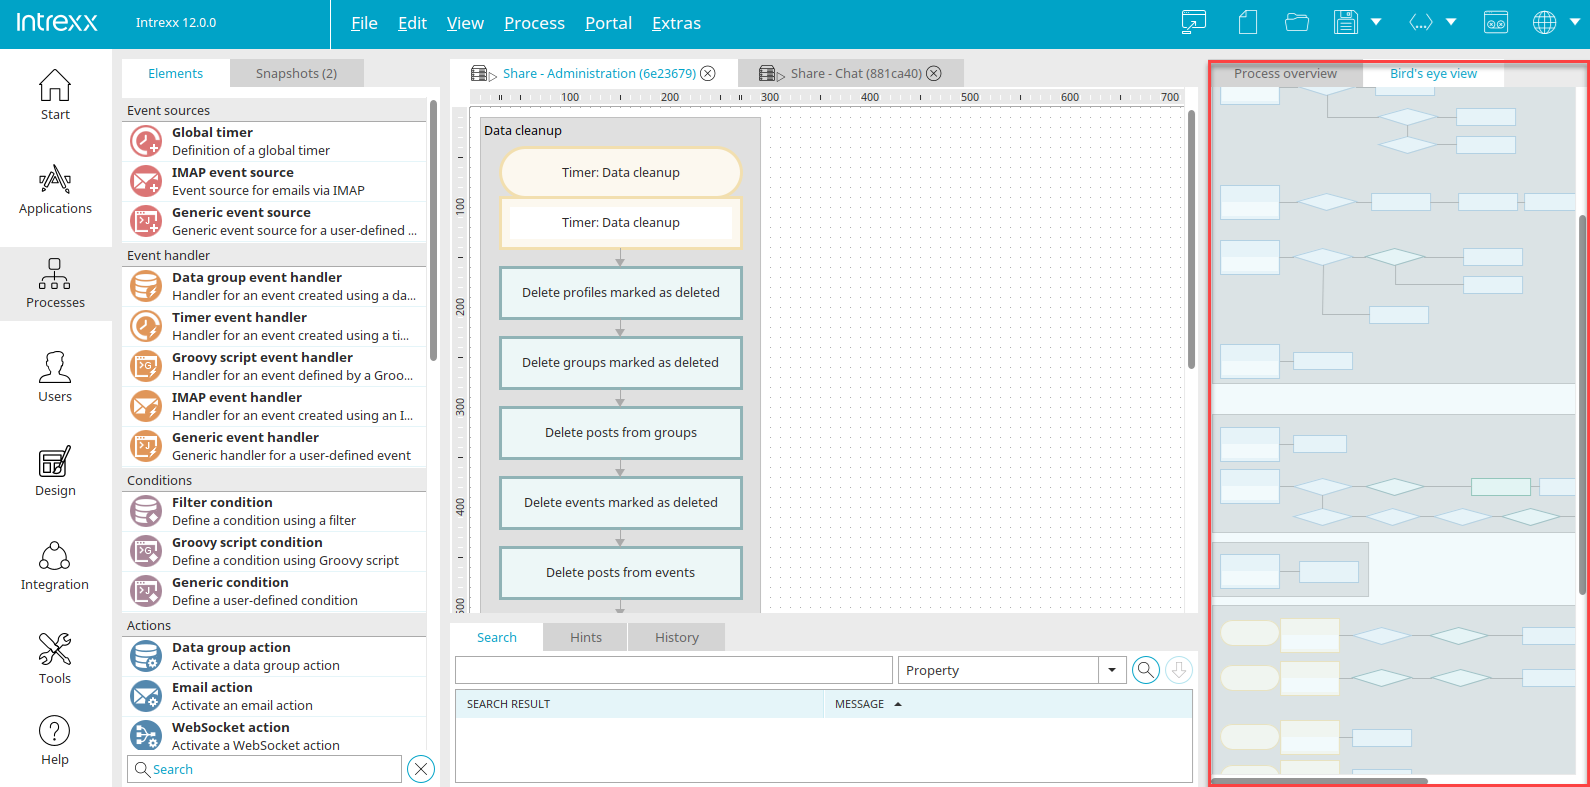
Here you'll find a scaled-down view of the process, and you can use a movable frame or double-click to navigate to the areas you want to see on the workspace.
If this section is not visible, you can display it from the "View" menu in the main menu if necessary.
"Automatic Scaling" Context Menu
Automatic scaling adjusts the entire process overview to fit the current size of the bird's-eye view area.
"Default Scale" Context Menu
Displays the process overview at a scale of 1:5.
"Zoom In/Out" Context Menu
Changes the zoom level of the bird's-eye view.
Search, Notes, History
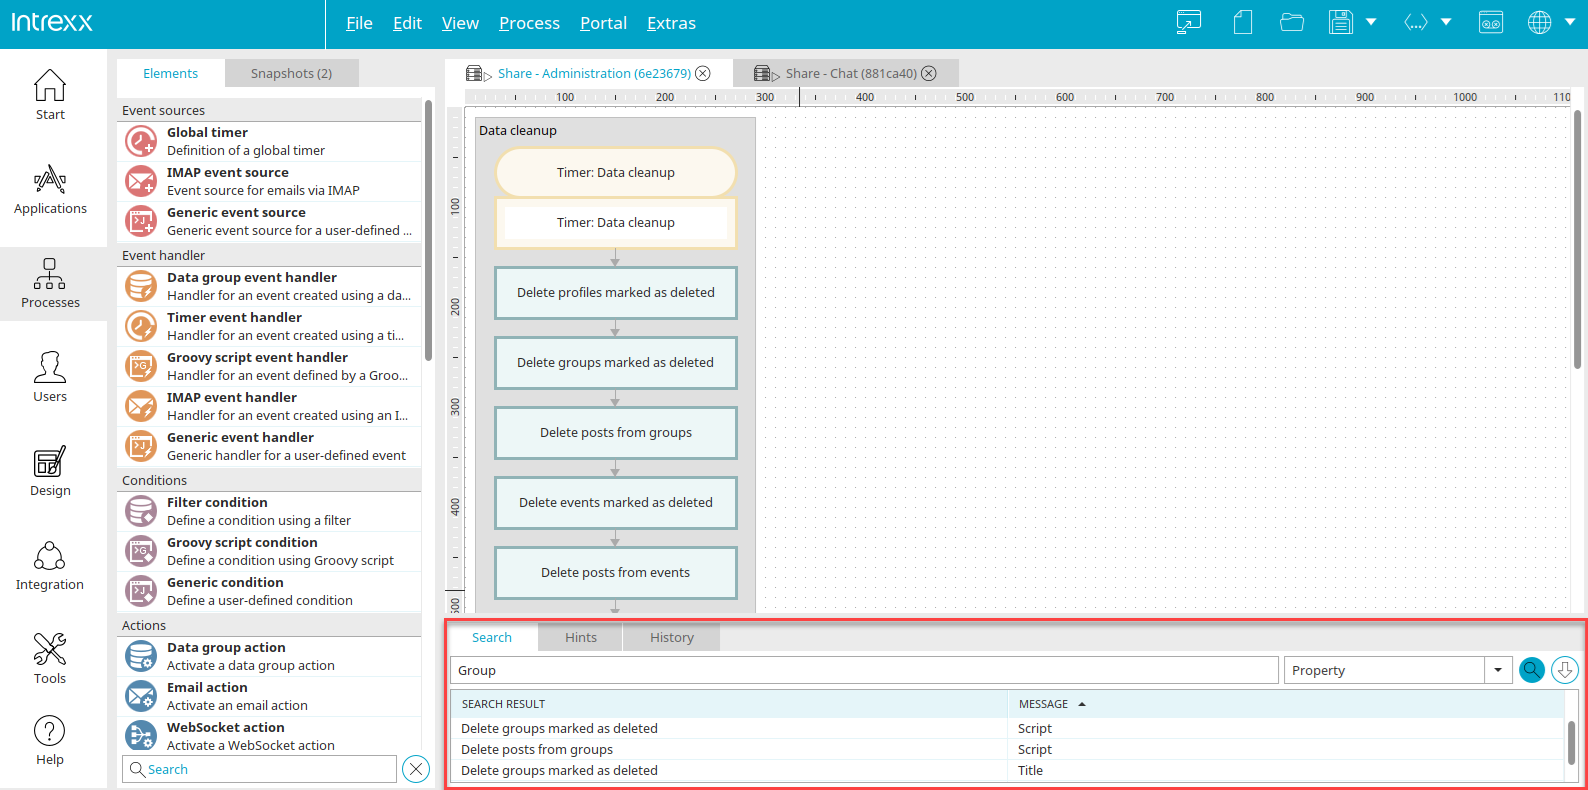
At the bottom, you'll find several tabs that can also be shown or hidden via the "View" main menu.
Search

Search field
Enter a search term here.
Shortlist
Various search functions are available here.
-
Property
Search for properties of elements.
-
GUID: Definition
Searches the currently open process for elements with the GUID entered in the search field.
-
GUID: Usage (in all processes)
The GUID entered in the search field is searched for in the current process as well as in all published processes. The results list displays the search results for the current process as usual, with results from processes other than the one currently open highlighted in color. Double-clicking on one of these search results opens the corresponding process.
Please note that when searching for a GUID within a process that was opened via a search result, you should run the search again to obtain a detailed search result.
-
Title
Search for the element title.
-
Description
Search for the element description.
 Search
Triggers the search. Search results are displayed below the search field, and clicking on a result highlights the corresponding item on the workspace.
 Search History
Opens a window with a list of the most recently performed searches. Click on a search action in the list to repeat it.
Notes

This section notifies you of any items on the workspace that are not fully configured or not connected. You can always recognize incompletely configured elements by this  icon. Errors when saving a process can have two causes:
An email action configured for a data group action was linked to a data group event handler configured for a different data group. The second cause may be an application that is not available in the portal, but whose data groups are referenced by the process. The warning in the notes remains until the process is next saved. Details about an entry in the notes are displayed as a tooltip when you hover over it with the mouse.
History

You can find all the information about this topic here.