Gauges
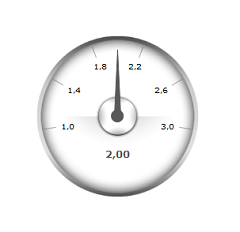
The gauge is suitable for displaying speed, volume levels, pressure, temperature or filling levels.
You can find an example of using the tachometer to display the users logged into the portal in one of our Tips & Tricks articles.
The "Speedometer " application element belongs to the "Images and files" element category.
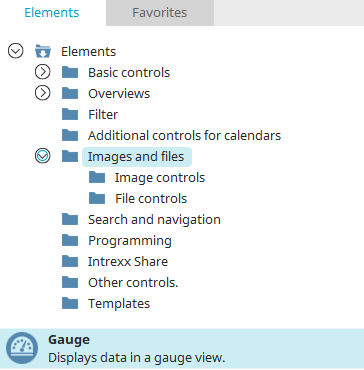
The speedometer element can be found in the "Applications" module in the "Elements" area. A new speedometer can be created by positioning the element on the workspace from here using drag & drop.
Further information on creating elements can be found here.
The properties dialog of a gauge element opens automatically when a new gauge is created. The properties dialog of an existing speedometer can be opened by double-clicking on the element on the workspace, via the "Properties" context menu or via the "Edit / Properties" main menu if the speedometer is selected on the workspace.
General
You will find the following settings on the "General" tab in the tachometer properties dialog:
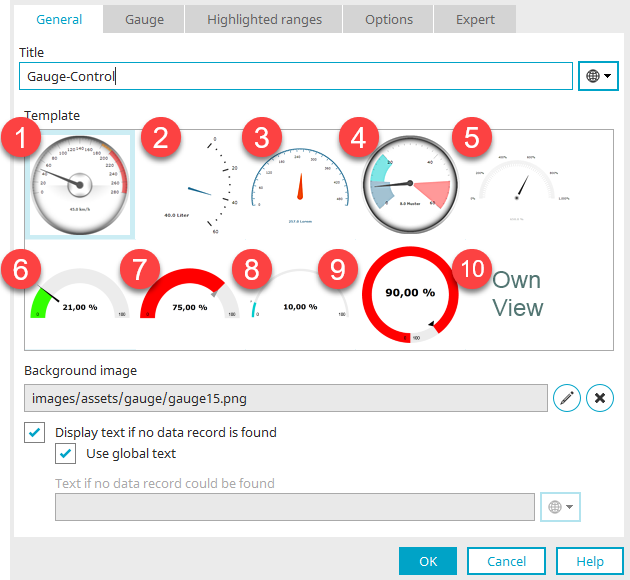
Title
Provide the gauge with a title here. Information on multilingual titles can be found here.
Document template
Here you can choose from a total of nine templates that can be used to select a background image for the gauge. Select "Custom view" (10) if you want to integrate your own background image.
Background image
The path to the background image is shown here.
![]() Select background image
Select background image
Opens the dialog for selecting the image.
![]() Delete background image
Delete background image
Deletes the link to the currently selected background image.
Display text if no data record is available
With this setting, text is displayed if no data is available for the speedometer display.
Use global text
The text from the language constant DR_NO_RECORD is used if the setting "Display text if no data record exists" is also set.
Text, if no data record is available
Here you can enter your own static text, including multilingual text.
Gauge
You will find the following settings on the "General" tab in the tachometer properties dialog:
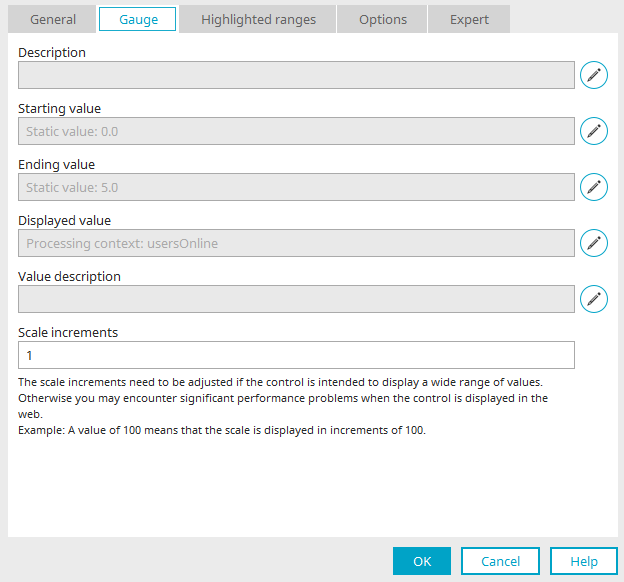
Description
This is shown as a title above the gauge.
Starting value / Ending value
The first and last value of the gauge's scale are defined here.
Displayed value
The data field, which provides the values for the gauge, is entered here.
Value description
Here, the units of the values can be specified, for example. The value description is displayed within the gauge.
Scale increments
Determines the increments the scale is displayed in. Scale increments cannot be defined for the At the 6. to 9. Template, which you can find on the "General" tab in the tachometer properties dialog, the scale graduation marks cannot be set. If one of these templates is selected, this setting is hidden here.
![]() Edit
Edit
Opens the dialog for editing values.
Edit values
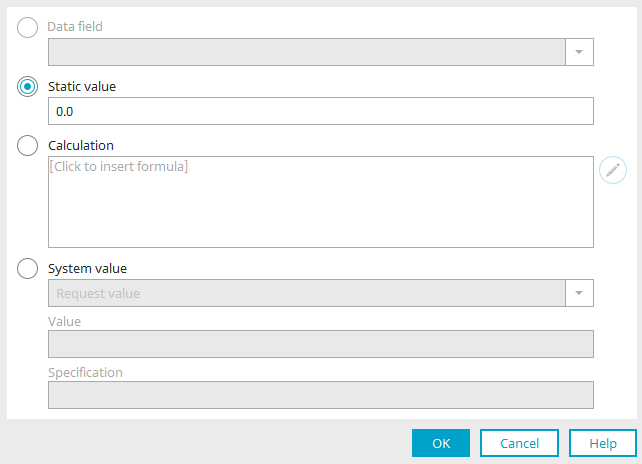
Data Field
If the speedometer is located on a view page in a data group, a data field that provides the data for the display can be selected here. However, this is not possible on top-level view pages.
Static value
A static value can be entered here.
Calculation
A formula can be defined here.
![]() Edit
Edit
Opens the formula editor.
System value
A system value can be used as the data source here. There are three types to choose from:
-
Request value
-
Session value
Value
Enter the name of the parameter here.
Default
Is used if no value is supplied from the system value.
Markings
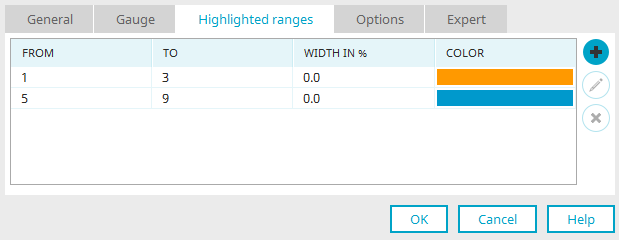
Markers can be used to color part of the scale in the gauge. Set the area and color you want to use here.
From / To" columns
Displays the start and end value of the highlighting.
Width in %" column
Displays the width of the highlighting as a percentage. This column is not displayed here if one of the 6. to 9. Templates was selected on the "General" tab in the properties dialog.
Color" column
Shows the color used for highlighting.
![]() Delete marking
Delete marking
Deletes the currently selected highlighted range.
![]() Add marker /
Add marker / ![]() Edit marker
Edit marker
Opens a dialog in which a marker can be created or edited.
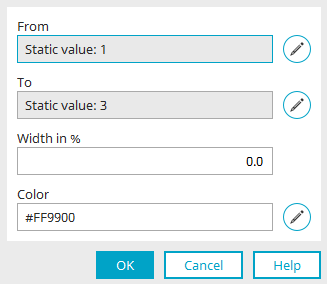
Define the values of a marker in the gauge here.
From / to
Define the start value and end value of the highlighting.
![]() Edit start value / end value
Edit start value / end value
Opens a dialog in which the data source for these values can be selected.
Width in %
Defines the width of the value range. The width cannot be set if one of the 6. to 9. Templates was selected on the "General" tab in the properties dialog.
Color
The hexadecimal value of the color used for the highlighting is shown here.
![]() Edit color
Edit color
Opens a color palette from which the color can be selected.
Options
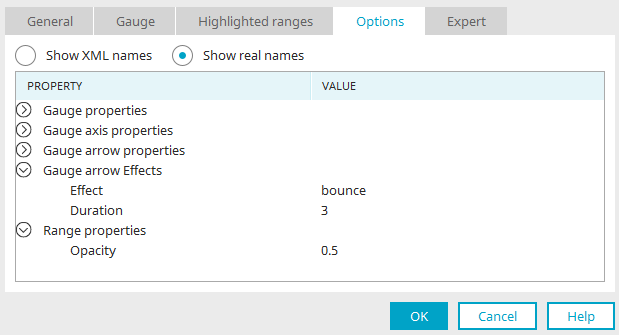
Show XML names
Displays the gauge's layout properties in XML.
Show real names
Displays the names of the gauge's individual layout properties
Further information on the customization options can be found in the API of the third party solution "amCharts".