Search - Statistics
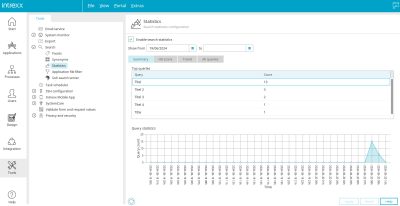
Enable search statistics
Search statistics will be created with this setting.
Show from / to
Specify the time period to be displayed here.
"Summary" tab
Top queries
"Query" column
Displays the most common search queries.
"Count" column
Displays the number of performed searches.
Query statistics
The statistics are displayed in diagram form here.
Apply
Clicking on this button saves the settings made.
Reset
Clicking on this button discards all changes that have not been saved.
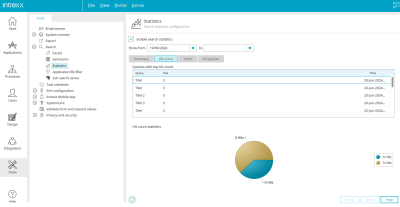
"Hit score" tab
Queries with top hit count
"Query" column
Displays the query.
"Hits" column
Displays the number of hits.
"Time" column
The date and time of the query is shown here.
Hit count statistics
The hit scores are displayed in diagram form here.
Apply
Clicking on this button saves the settings made.
Reset
Clicking on this button discards all changes that have not been saved.
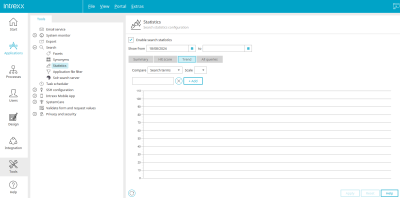
"Trend" tab
Compare
Select whether search terms or intervals should be compared here.
Scale
Select the type of scaling here.
Filter field
A search term can be entered here. The diagram below will be filtered based on this.
Add
Adds another filter field if search terms have been selected for the comparison. If intervals have been selected, a filter field cannot be added.
![]() Remove filter field
Remove filter field
Removes the corresponding filter field.
Chart
The trends are displayed in diagram form here.
Apply
Clicking on this button saves the settings made.
Reset
Clicking on this button discards all changes that have not been saved.
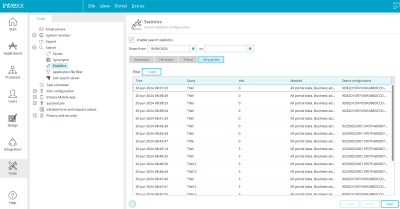
"All queries" tab
This tab shows a complete list of all queries with time, query, hits, the module in which hits were obtained, or the search configuration in which hits were obtained.
Filter field
A search term can be entered here. The diagram below will be filtered based on this.
Add
Adds another filter field if search terms have been selected for the comparison. If intervals have been selected, a filter field cannot be added.
![]() Remove filter field
Remove filter field
Removes the corresponding filter field.
"Time" column
The date and time of the query is shown here.
"Query" column
Displays the query.
"Hits" column
Displays the number of hits.
"Module" column
Displays which module the hit was made in.
"Search configuration" column
Displays the GUID of the search configuration via which the hit was obtained.
Apply
Clicking on this button saves the settings made.
Reset
Clicking on this button discards all changes that have not been saved.
The search statistics are principally non-personal.
More information
Settings in the "Tools" module
-
Synonyms
-
Application file filter Elasticsearch
Search configuration in applications
Additional control for the portal-wide search in the "Design" module


