Tips & Tricks - Intrexx server monitoring
In this article, we would like to take a closer look at the so-called JMX console. With the Java Management Extensions (JMX), it provides a technology that lets monitor and manage applications programmed in Java. The various tasks are performed by so-called MBeans. This gives administrators even more comprehensive options for monitoring and maintaining the Intrexx server.
For security reasons, JMX is deactivated by default for your Intrexx portal.
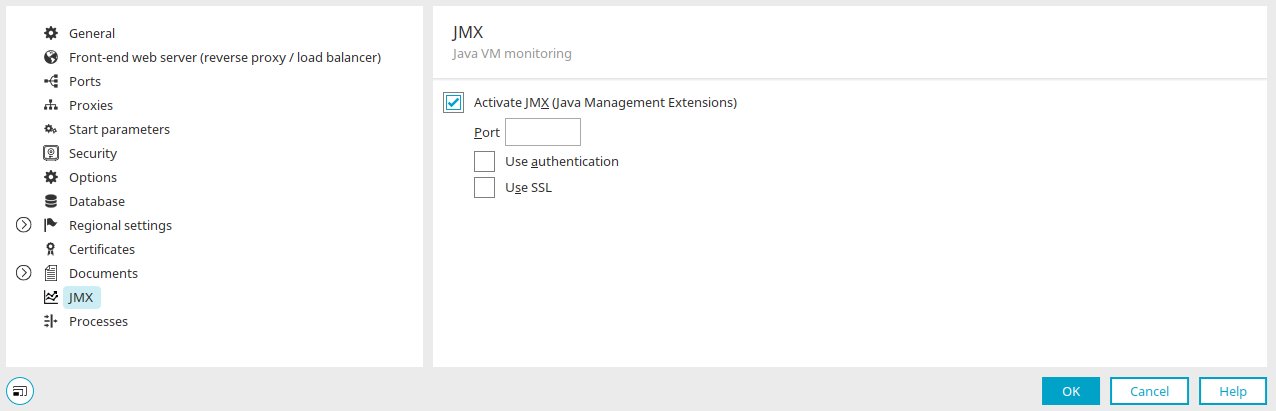
You can activate JMX in the portal properties. Enter a free port for communications between JConsole and the Intrexx server. Press F1 if you need help with the other settings in the dialog. After making changes, restart the portal service.
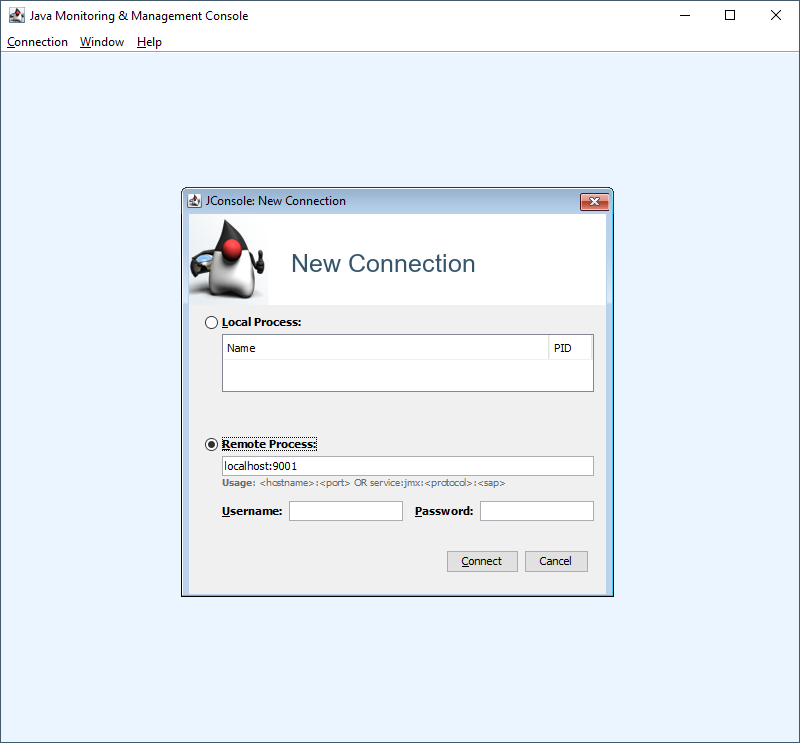
To start the JMX console, run the "jconsole.exe" file (Linux: "jconsole.exe if graphical user interface, if headless via remote") in the installation directory java\packaged\windows\amd64\bin (or relevant path in Linux).
On the login screen, log in with "servername:port". You do not need a username and password for this connection. This type of login should not be used long-term because if the server address and port are known, users can establish a JMX connection at any time. However, it is not unreasonable for development and diagnostic purposes. So if you do not need the JMX console, deactivate the corresponding setting in the portal properties and restart the portal service.
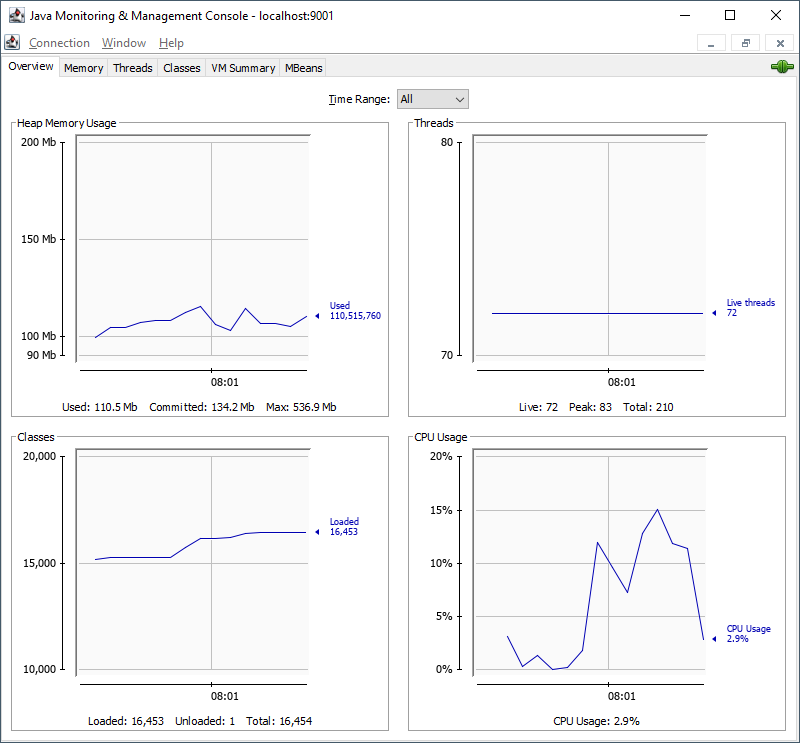
After calling the JMX console, the monitoring window is opened with various tabs. On the first tab, you will see a number of graphs showing various values such as CPU usage and the number of live threads. The graphs are updated every second. This helps you to track the resource usage accurately.
The "Memory", "Threads", "Classes" and "VM Summary" tabs provide you with more information for analysis. The last tab "MBeans" provides an overview of the implemented MBeans that are integrated into JMX by default. In addition, the folder "en.uplanet.lucy.server.management" contains specific MBeans implemented by INTREXX Ltd that provide special portal analyses and methods for administration tasks.
Overview / Memory

You can monitor the memory usage of the server here like in the system monitor in the Portal Manager. In the JMX console, however, these values can be read more accurately. The memory consumption is usually displayed as a zigzag curve. The Java machine performs automatic garbage collections in order to keep sufficient memory available. If necessary, you can also perform manual garbage collections (GC) to free up memory. The information includes the current memory usage of the heap, the maximum allocated memory for the heap, maximum memory usage by the heap and information about the garbage collector.
Threads
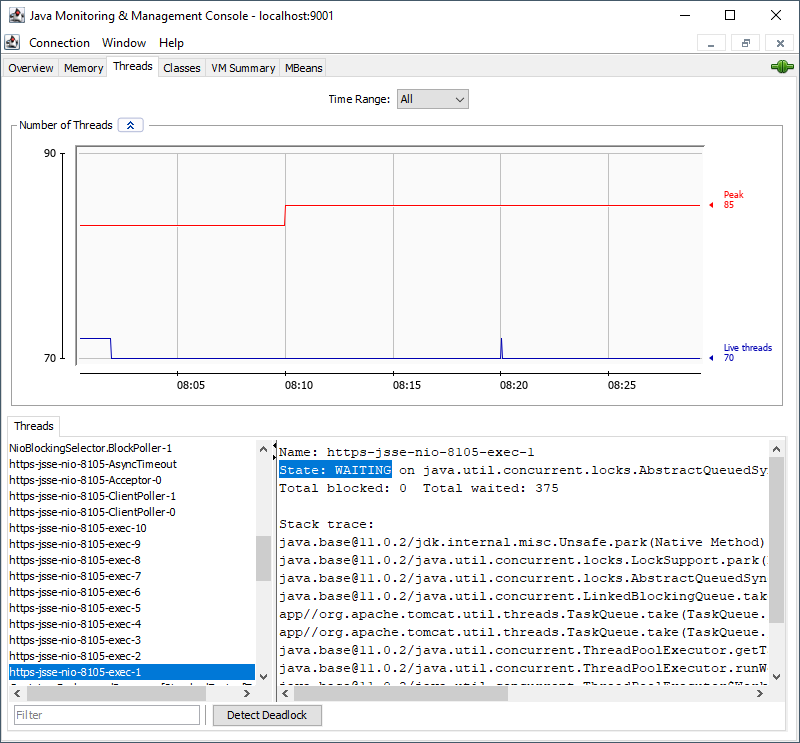
The WebConnectorWorker threads are most important when it comes to the threads. They can be recognized by the port number of the web connector in the thread name (e.g. http-nio-0.0.0.0-8102-exec-123, 8102 is the port number of the web connector assigned in the portal properties). The information here can be helpful for troubleshooting if the portal is no longer accessible in the browser but the web server (IIS / Tomcat) is running correctly. Ideally, the status of a WebConnectorWorker thread is "waiting" - i.e. it is ready to answer requests from the browser. The graph shows the current number of live threads and the highest number of live threads since the last portal service start.
Classes

Here the number of classes currently loaded into the memory is displayed as well as the total number of loaded or unloaded classes.
VM Summary
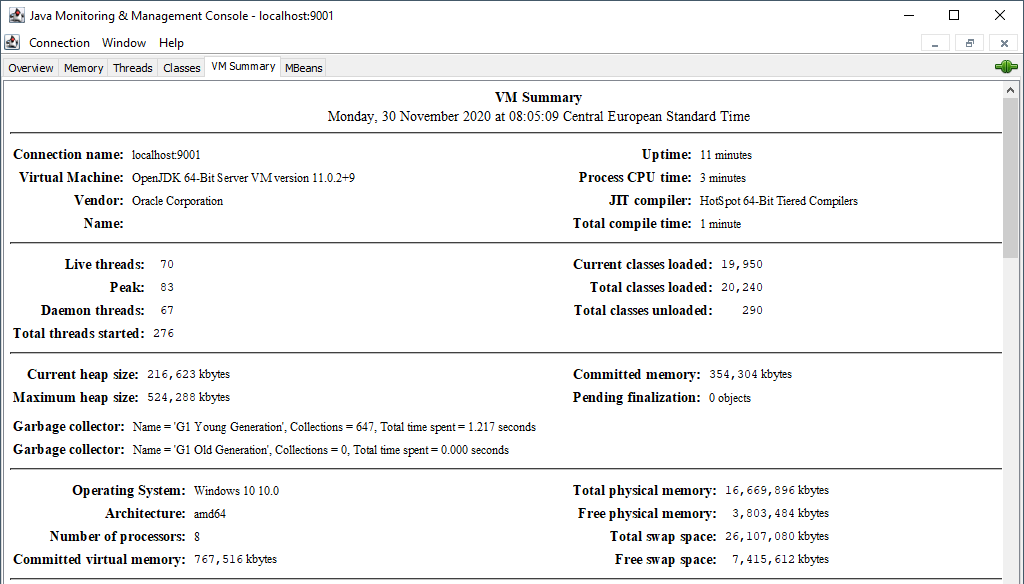
Here you will find information about your portal server, such as uptime, loaded Java classes, memory consumption, live threads, etc.
MBeans
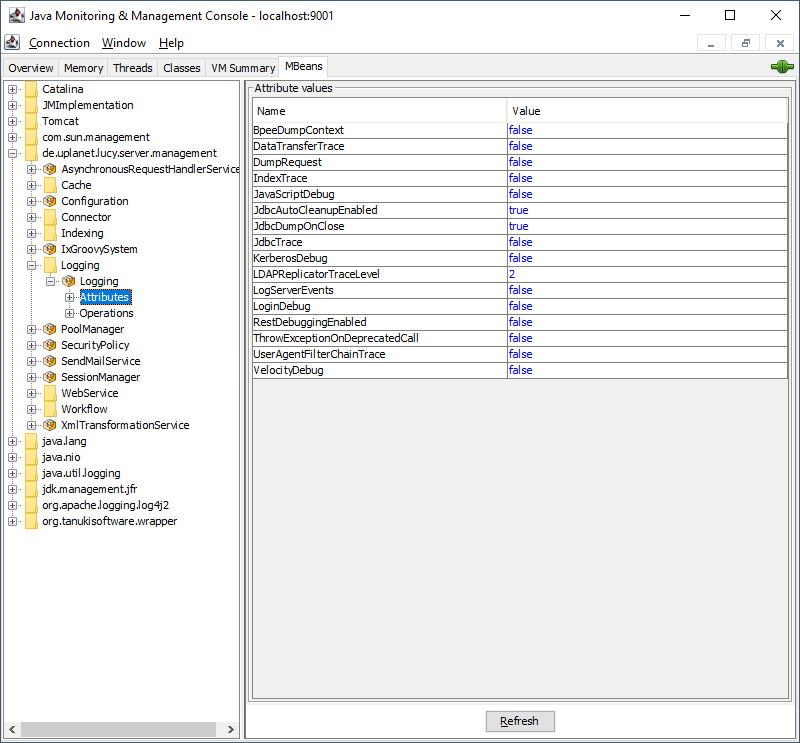
To mention all MBeans here would go beyond the scope of this article. Therefore, some specific logging MBeans from INTREXX Ltd are listed and explained below.
de.uplanet.lucy.server.management - Logging
|
Attribute |
Data type |
Description |
|---|---|---|
|
JdbcTrace |
Boolean |
If "true", all database queries will be logged in the portal log. This information helps to determine the speed of database queries if a portal has performance issues, for example. This information helps to determine the speed of database queries if a portal has performance issues, for example. |
|
JdbcDumpOnClose |
Boolean |
If "true", information (origin, creator etc.) about unclosed DB connections is written to the portal.log. |
|
ThrowExceptionOn-DeprecatedCall |
Boolean |
If "true", an error message is written to the portal.log if a deprecated method is called. |
|
BpeeDumpContext |
Boolean |
If "true", the Bpee context variables and their values are written to the portal.log |
|
Operation |
Description |
|---|---|
|
logSeparator / logString |
Adds separators or text to the portal.log to make the log easier to read when troubleshooting. |
|
logThreadStacks |
Writes the stacktrace of the WebConnectorWorker threads to the portal.log. This is helpful, for example, if you want to determine the cause of a portal shutdown in the browser. |
de.uplanet.lucy.server.management - WebConnector
|
Attribute |
Data type |
Description |
|---|---|---|
|
Timeout |
Long |
Timeout of the web connector (in ms, default 10 min). |
|
Running |
Boolean |
Is the web connector running? |
|
WorkerThreadCount |
Integer |
Number of available worker threads. |
|
AliveWorkerThreadCount |
Integer |
How many worker threads can be used at the moment? |
|
WatchdogInterval |
Long |
Monitors threads for activity. When the timeout is reached, the worker thread is recycled. |
|
RequestCount |
Integer |
Number of open requests. |
|
BusyCount |
Integer |
Number of tasks currently processed. |
|
LogRequestProcessingTime |
Boolean |
If "true", the time taken to execute a request from the browser to the WebConnector thread is written to the portal.log in milliseconds. This helps you investigate performance problems. |
|
Operation |
Description |
|---|---|
|
startConnector |
Starts the web connector |
|
stopConnector |
Stops the web connector |