Groovy Remote Debugging
This feature allows for the debugging of Groovy script on the server. This does not involve implementing a separate debugger in Intrexx, instead it simplifies the connection to the IntelliJ Remote Debugger.
Settings in the Portal Manager (Server)
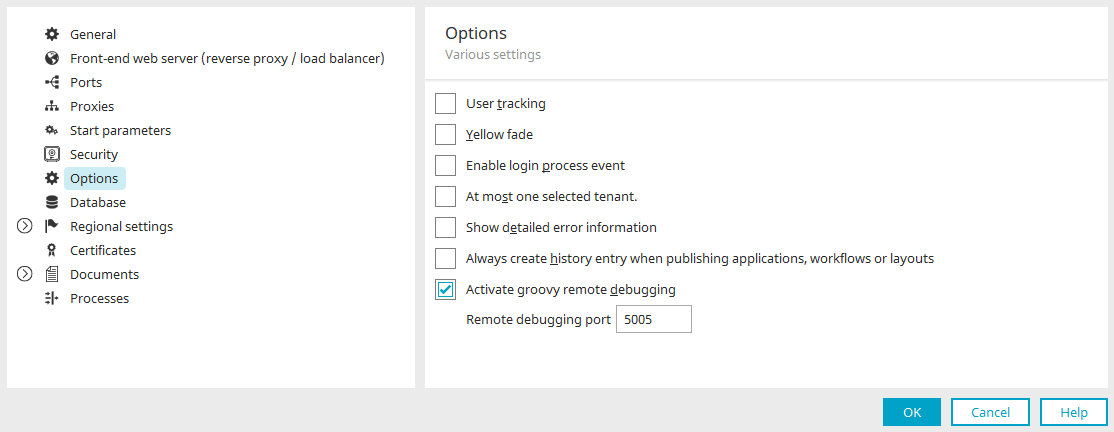
Debugging settings can be enabled in Portal Properties / Options. The portal properties can be found in the main menu "Portal".
The portal service must then be restarted.
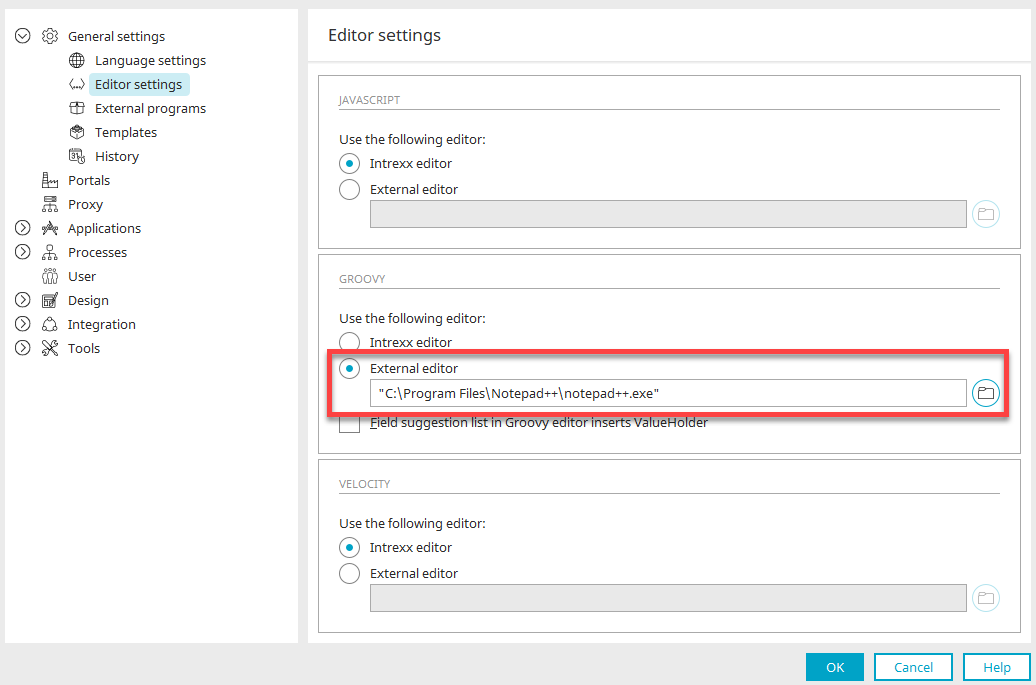
The path to IntelliJ must also be defined.
The path can be entered via the main menu "Extras / Options / General / Editor settings". The corresponding Groovy script can then be opened via the external editor.
IntelliJ Remote Debugger - Settings
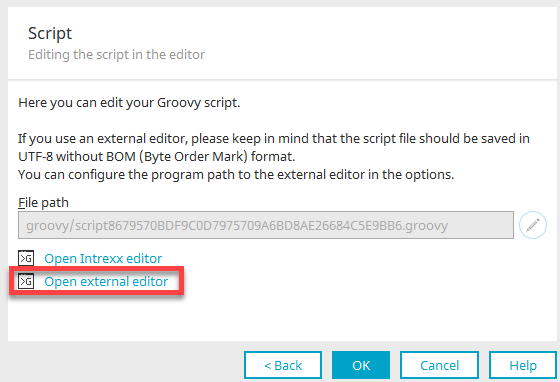
Click on "Open external editor" to open IntelliJ.
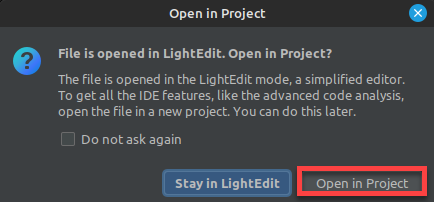
Select "Open in Project" here.
Confirm here with "Trust Project".
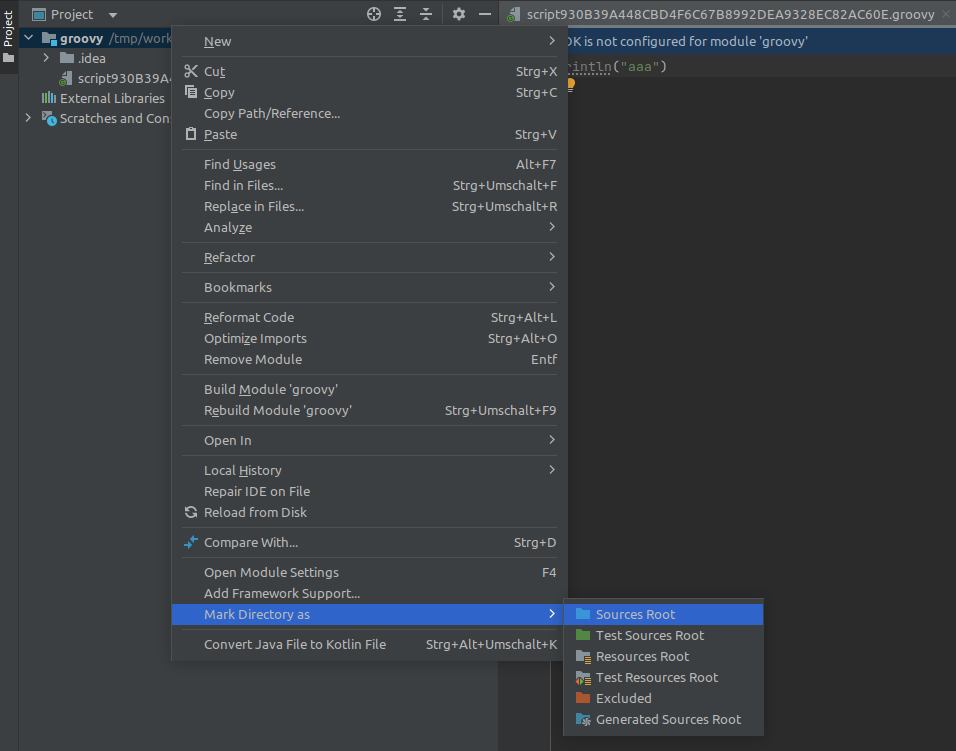
Mark the Groovy directory as the Sources Root Directory.
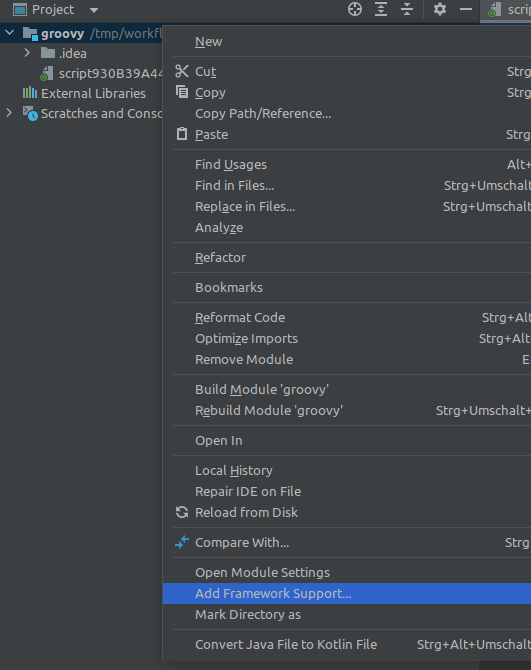
Framework support for Groovy must then be added.
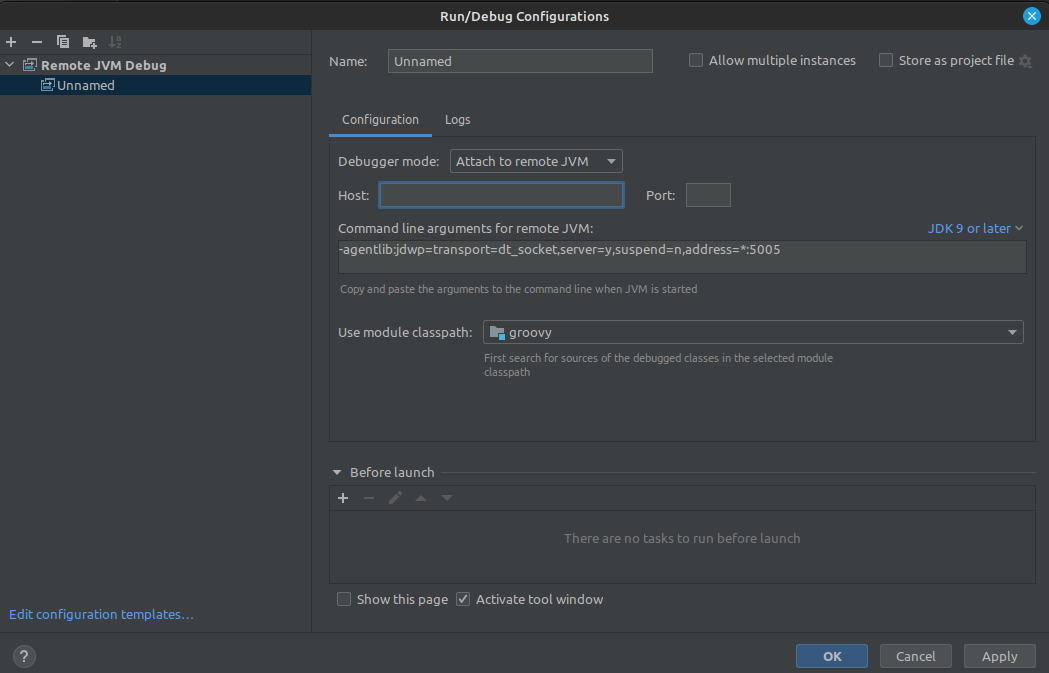
Finally, a run configuration for remote debugging must now be created.
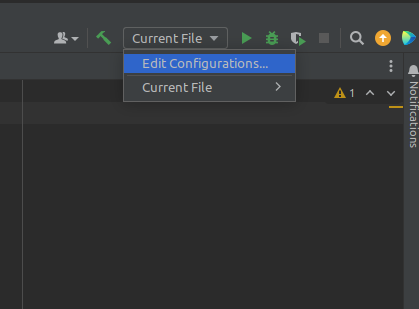
Select "Edit Configurations" here.
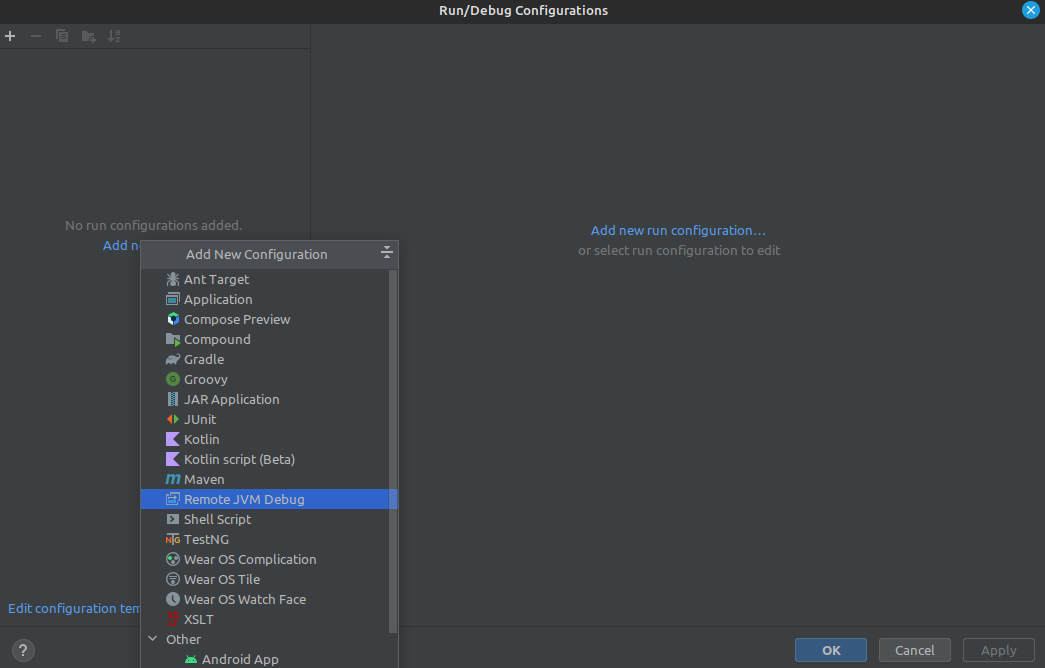
Select "Remote JVM debug" here.
The host and port specified in the manager must be specified here.
Breakpoints can now be set and remote debugging can be started by clicking on the debug icon.
