System Monitor - Databases
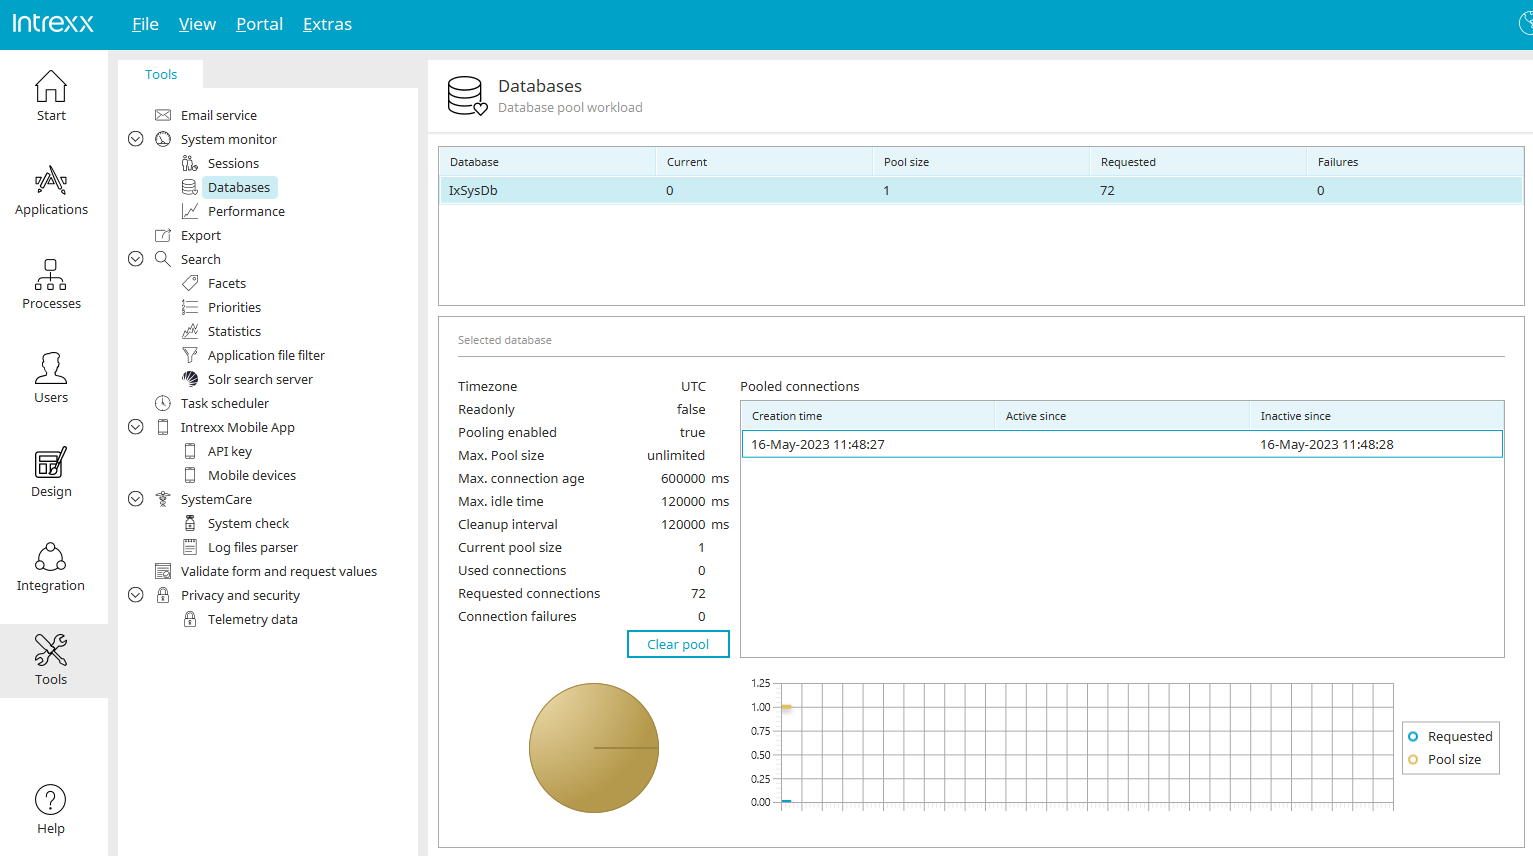
In the "Tools" module, the system monitor informs you about the utilization of the data pool if you select the "Databases" entry in the left-hand area.
The upper area contains the name of the database, the number of current database connections, the pool size, the number of requested connections since the portal was started and information about any failed connection attempts.
The area below that contains details on the selected database and provides the option of emptying the pool.
The database activity is presented graphically in the lower area.